Switzerland: Glass and reusable packaging on the rise in Out-of-Home
Published by DIGITALDRINK, in SwissDrink Inside 2023.11
A new Market Study of SwissDrink, the largest Association of independet Beverage Wholesalers in Switzerland, takes a detailed look at the development of beverage sales in the out-of-home sector in Switzerland over previous years and delivers exciting insights into the packaging materials and reusable parts used.
Reusable containers, especially those made of glass, have a long tradition in the beverage industry. Reusable glass packaging was not only popular in the days of the milkman. Many breweries, mineral springs and softdrinks producers have always relied on reusable packaging. However, the handling and logistics are more complex, as the empties have to be returned from the point of consumption to the producer and be cleaned.
For the following analyses, we look at sales of softdrinks, mineral waters, juices, functional beverages and beers from 2018 to 2023.
Beverages mainly in PET or glass
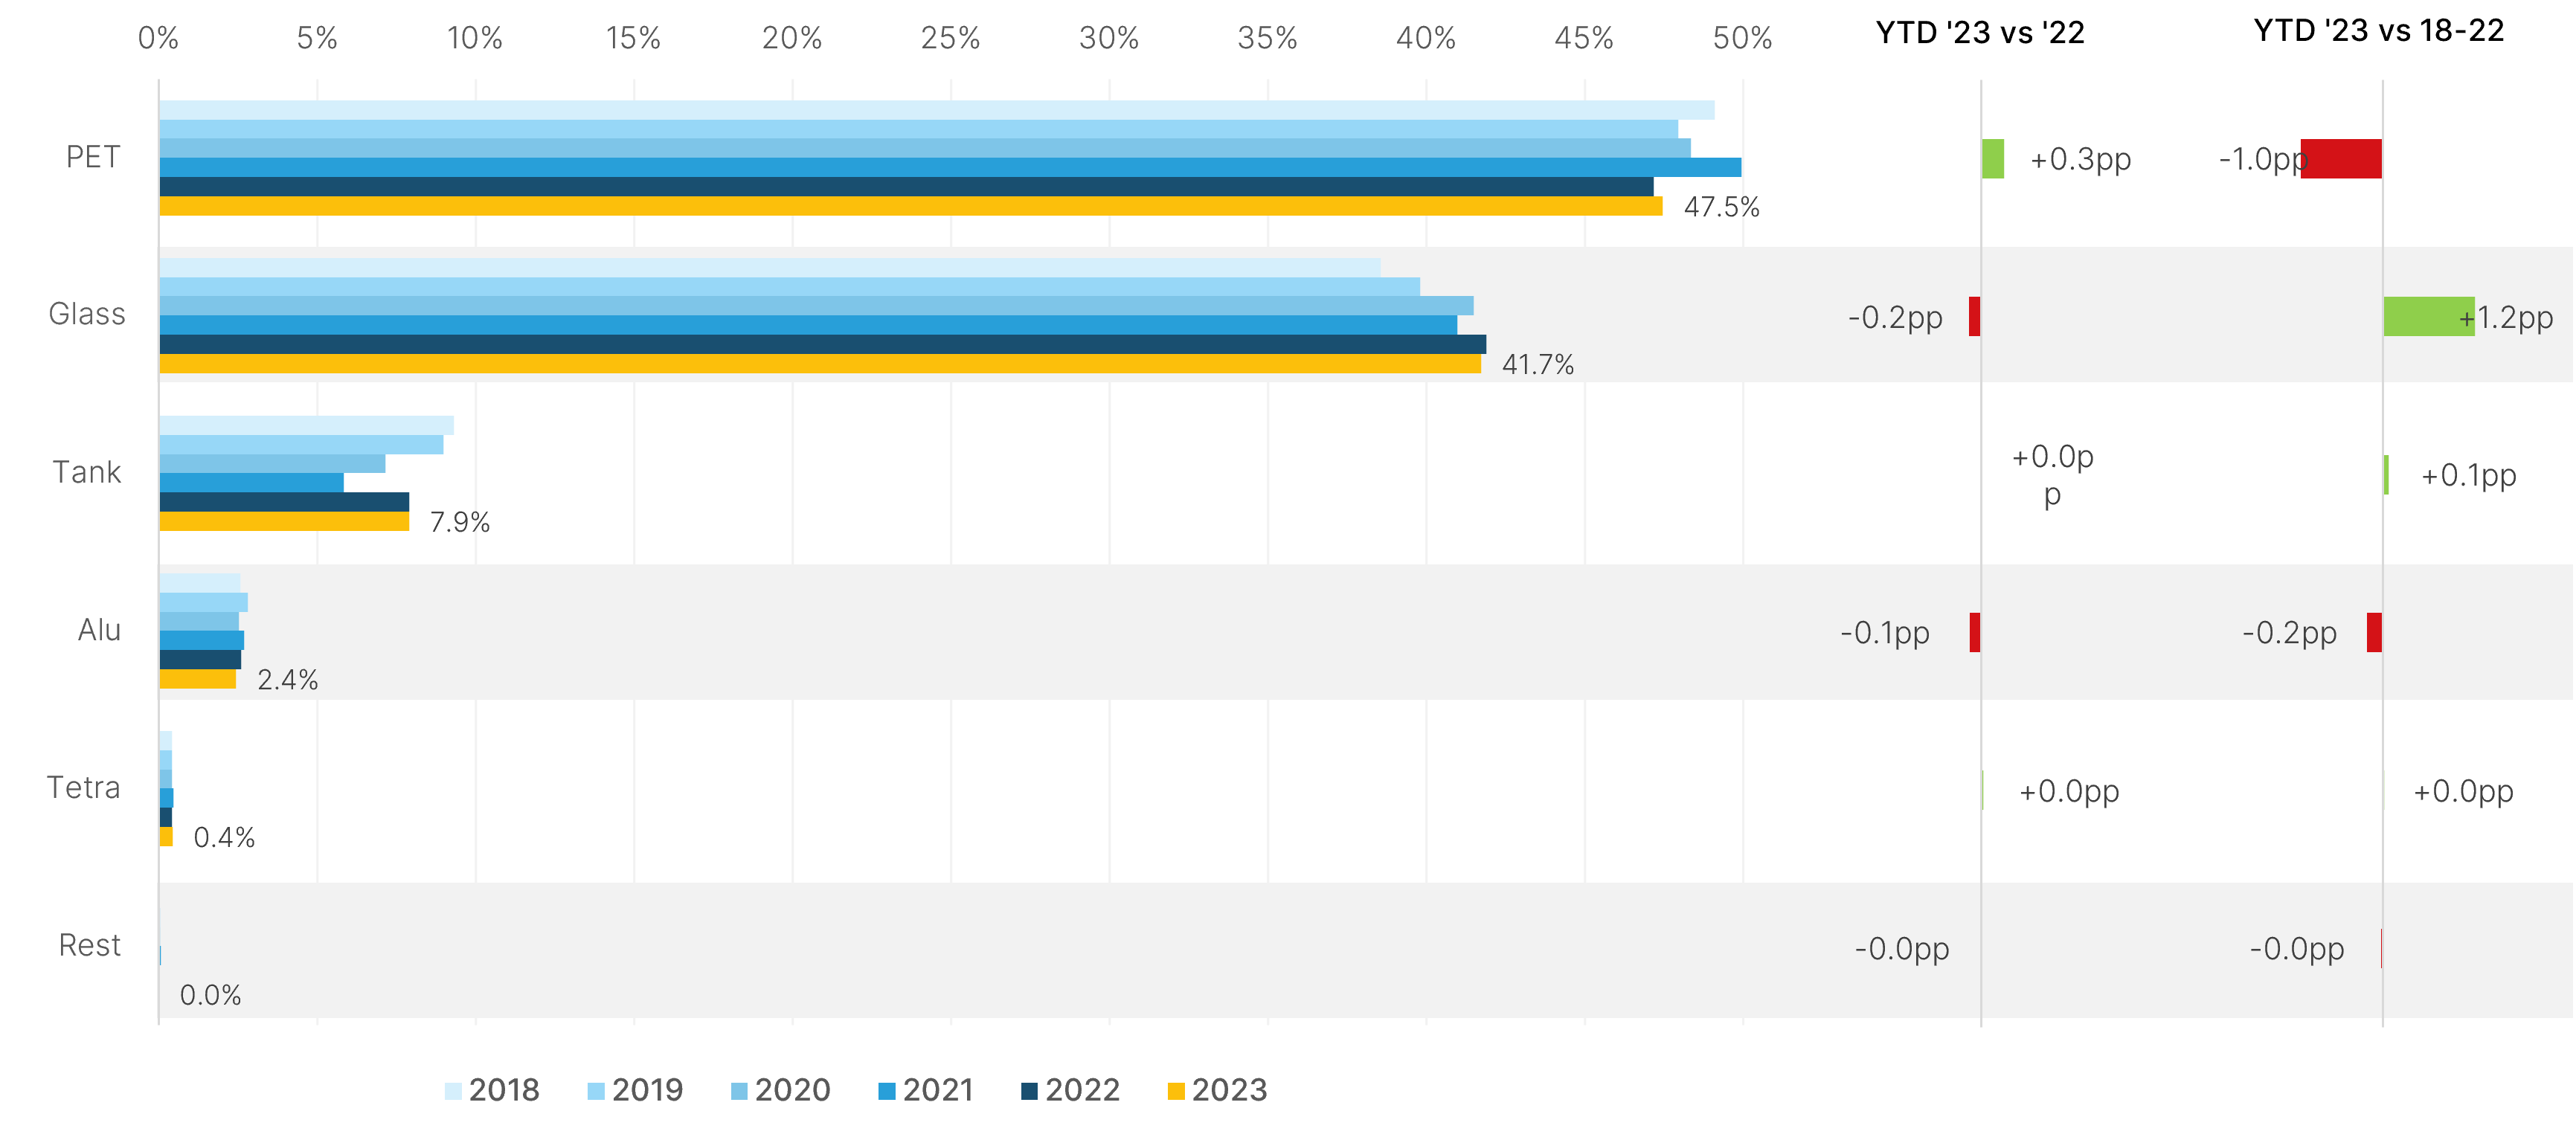
Across all distribution channels supplied by beverage wholesalers, almost half of the volume (47.5 %) is consumed from PET packaging (see Fig. 1), directly followed by glass packaging with 41.7 %. Only around one in ten liters is consumed from a tank, aluminium or cartonpack.
Packaging material by volume share
Categories: Water, softdrinks, juices, functional beverages & beer | Shares based on quantities in liters

Figure 1: PET light declining, in favor of Glass packaging
PET down slightly
Although consumption from PET packaging has increased by 0.3 percentage points compared to the previous year, it shows a decline of 1.0 percentage points compared to the average of the last five years. In 2021, the proportion of PET was generally higher due to increased consumption at home as a result of the Covid protection measures.
The trend for glass containers is the opposite. While a slight loss can be seen compared to the previous year, the share has increased almost continuously over the last five years and is up on the average from 2018 to 2022 by 1.2 percentage points.
Beverage Shops sell more by the glass
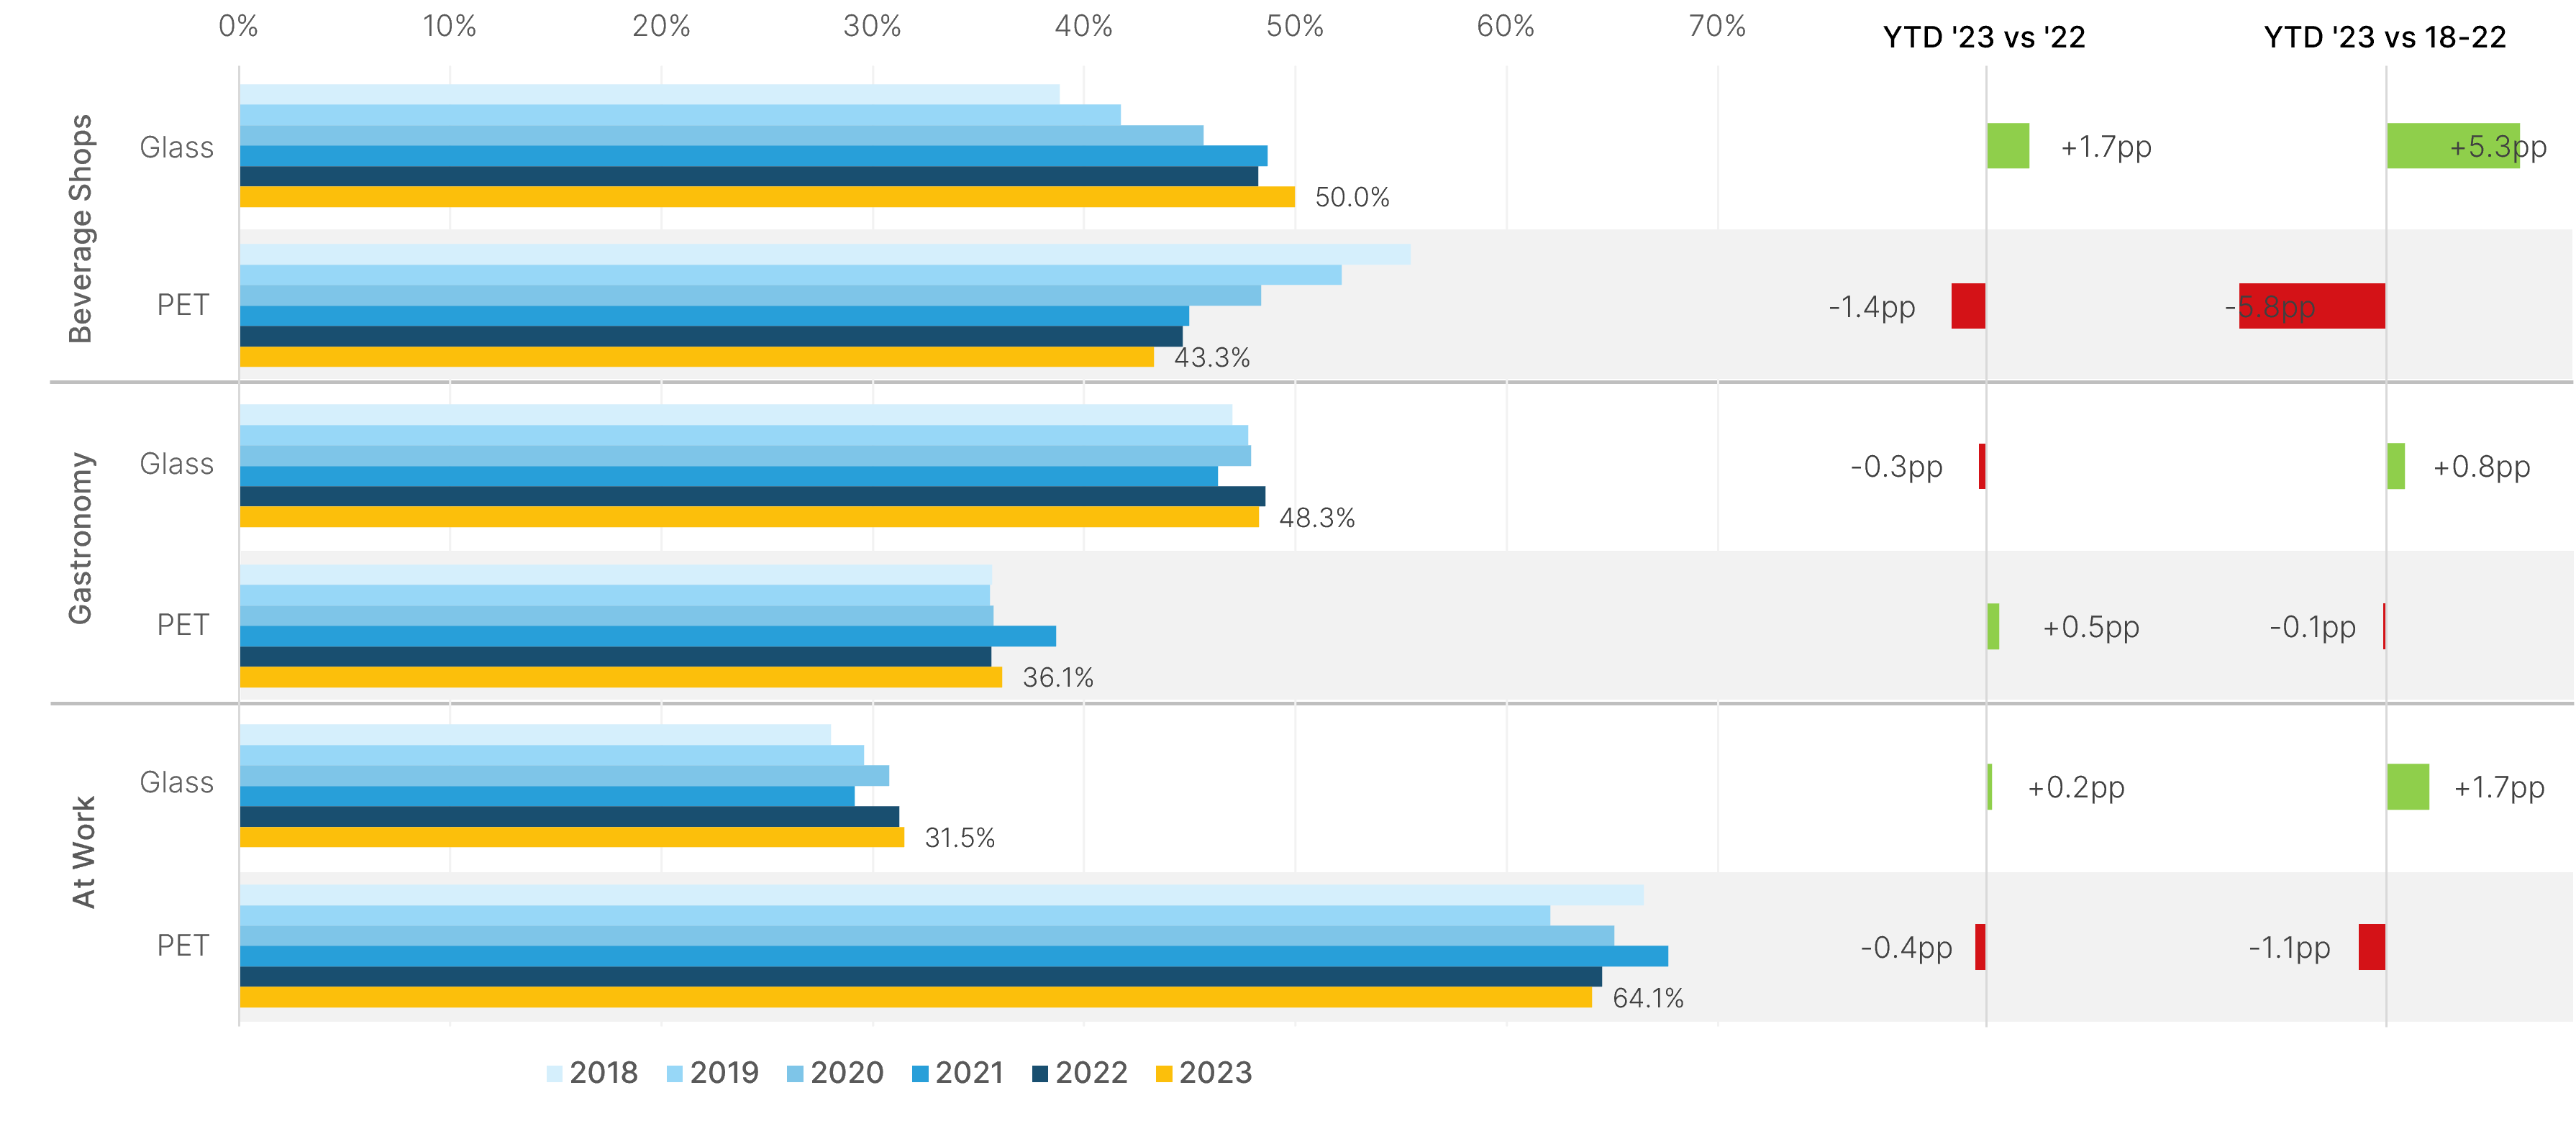
The developments per sales channel are exciting. Just a few years ago, beverage pick-up and specialty shops sold significantly more beverages in PET bottles than glass bottles. This year, the share of glass at 50 % is well ahead of PET at 43.3 % (see Fig. 2).
Packaging material by volume share in main distribution channels
Categories: Water, softdrinks, juices, functional drinks & beer | Shares based on quantities in liters

Figure 2: Consistently positive trends to glass compared to the last five years
Gastronomy with stable glass content
In the food service sector, the distribution of these two types of packaging is relatively stable, with glass at 48.3 % and PET at 36.1 %. With a slight outlier in 2021, also due to the Covid measures, there is a slight overall trend towards glass packaging. At 64%, at- work establishments generally drink from PET bottles much more often, although glass packaging has also increased by 1.7 percentage points compared to the average of the last five years.
Glass water is on trend
A look at the main packaging used within the beverage categories also reveals long-term trends.
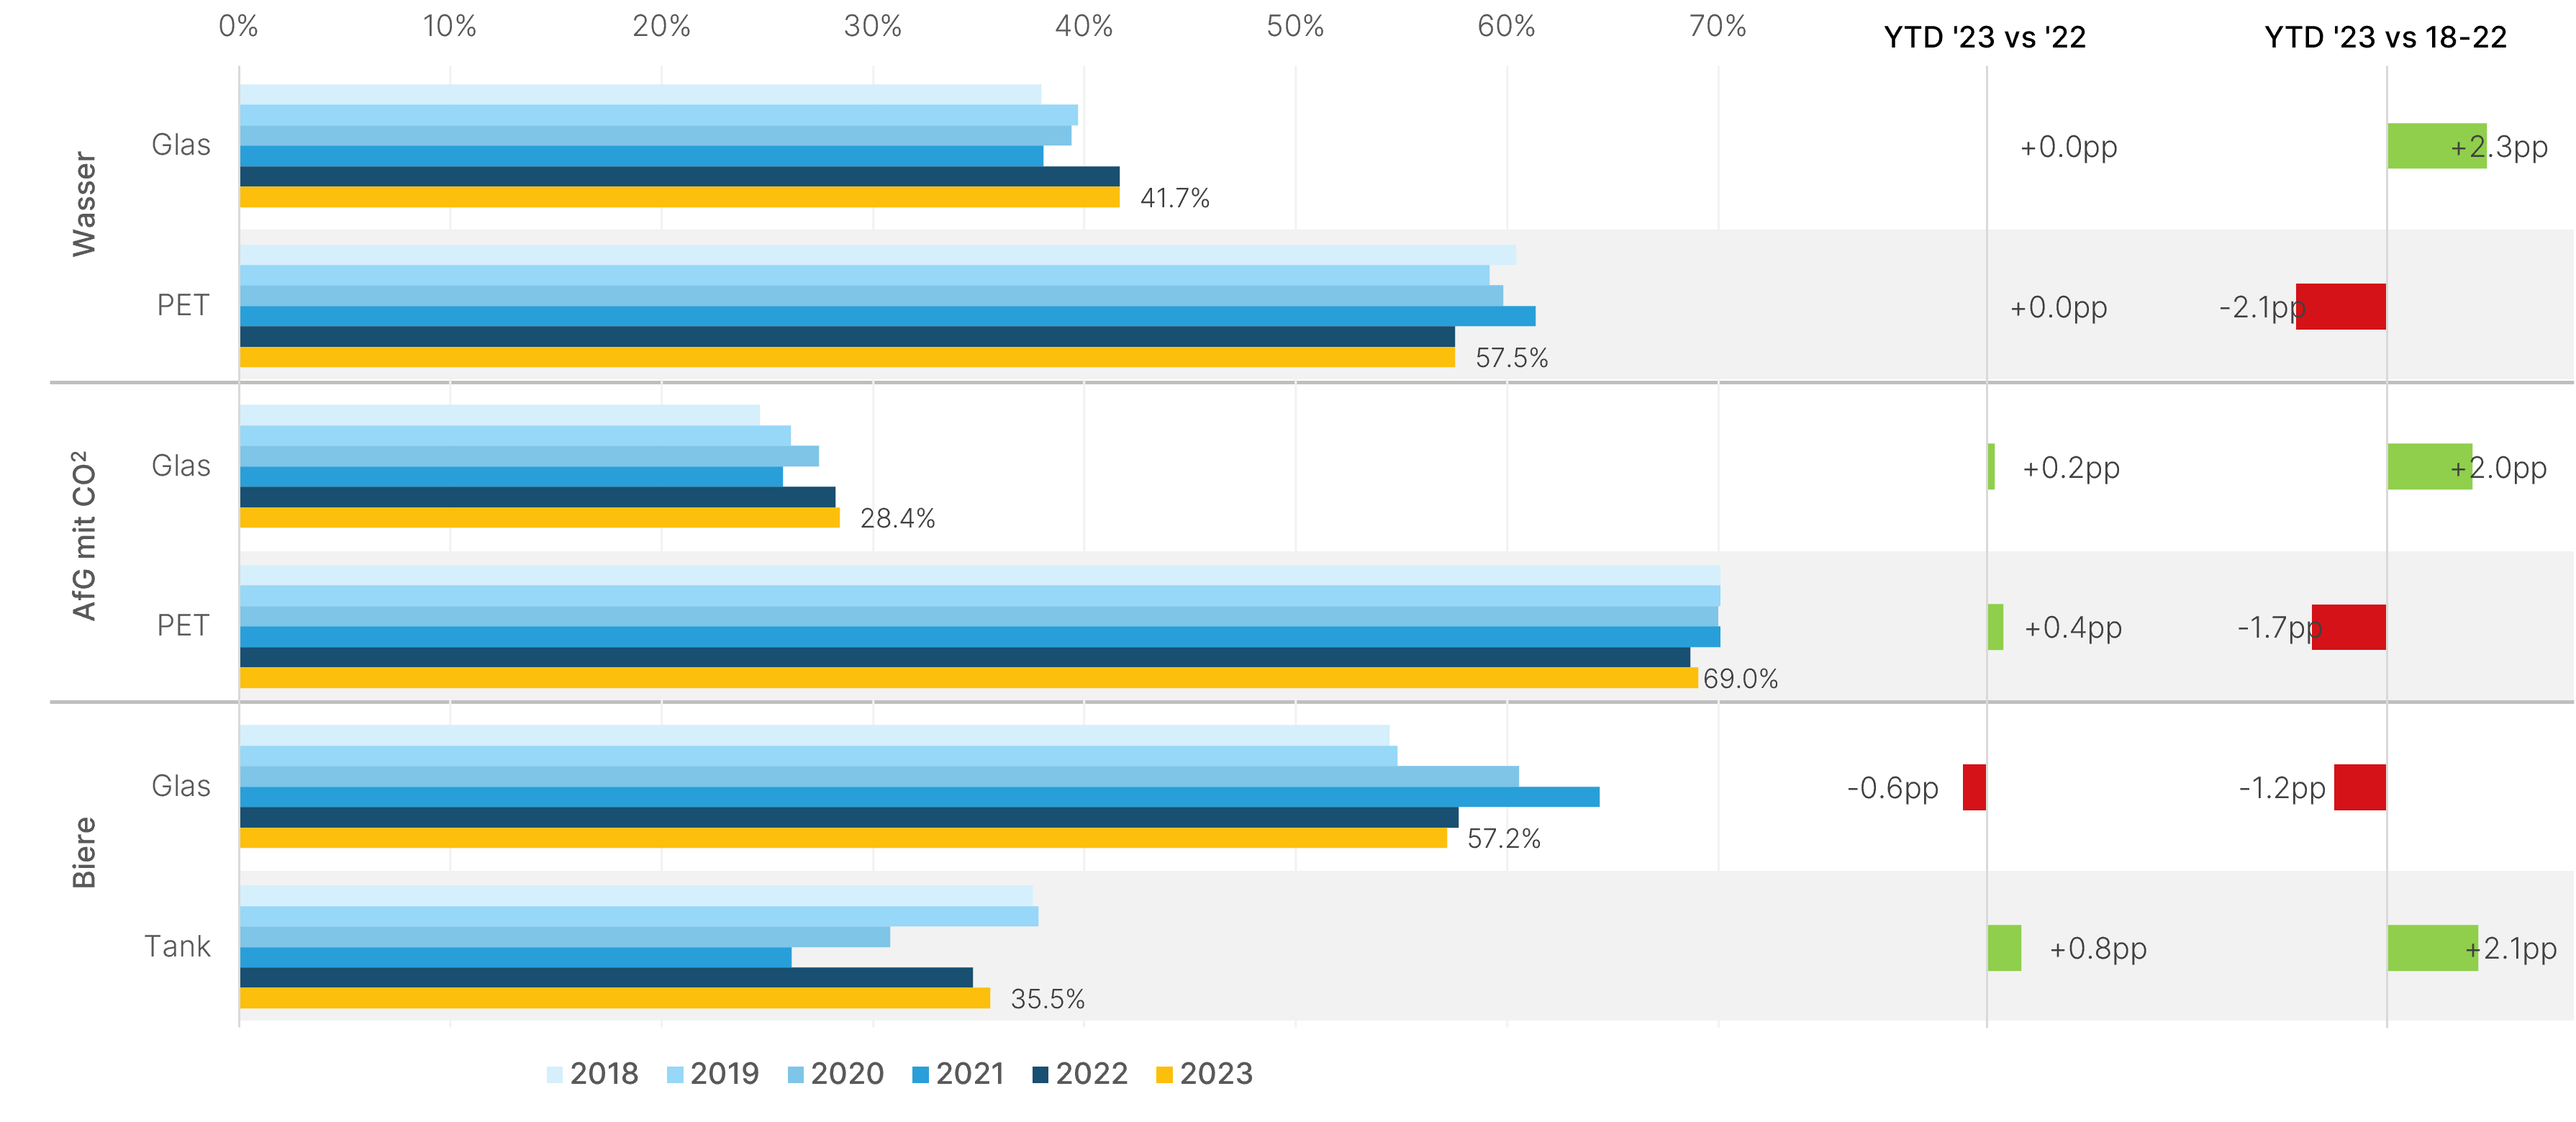
While the consumption of mineral water in PET and glass bottles is at the same level as in the previous year at 57.5 % and 41.7 % respectively, there is a clear shift of over 2 percentage points from PET to glass compared to previous years (see Fig. 3).
Packaging material by volume share in main categories
Categories: Water, softdrinks, Beer | Shares based on volumes in liters

Figure 3: PET for Water and Softdrinks slightly declining in the longer term
Softdrinks with a high PET content
For carbonated softdrinks, the proportion of PET containers is generally very high at 69 %, while only 28.4 % is consumed in glass bottles. Compared to the previous year, both types of packaging increased slightly, mainly at the expense of aluminum containers. A longer-term comparison shows a similar shift as for water from PET to glass.
Beer from glass and tank
Unsurprisingly, PET packaging is not relevant for beer. After glass at 57.2 %, beer is the second most commonly consumed beverage from tanks at 35.5 %.
Draught beer in particular, which is often served at festivals and events, has fluctuated strongly in favor of glass in recent years due to the restrictions on events. If you compare the development with the pre-coronavirus figures from 2018 to 2019, you can also see a slight trend towards glass for beer at the expense of tanks and aluminum containers.
Packaging influences the reusable quota
Which packaging is used for consumption ultimately has a strong influence on the reuse rate. While tanks, with a few exceptions made of PET or other plastics, can be reused, both disposable and reusable containers are used for glass. Although PET and aluminum bottles and cans have a high recycling rate in Switzerland, they are not reusable, with the exception of a few imported products.
Slight increase in reusable quota
The analyzed sales of the beverage wholesalers result in an overall reusable quota of 47.1 %. This is therefore 0.1 percentage points higher than in the previous year and a full 1.6 percentage points ahead of the average for the last five years.
The ratio differs greatly in some cases between the various sales channels and categories, which is due to the different packaging represented.
Gastronomy with a high reusable quota
In at-work establishments, only one in three liters (32.4 %) is consumed from reusable containers, albeit with a slight upward trend compared to previous years (see Fig. 4). In the gastronomy sector, the proportion is an above-average 59.9 %. Unfortunately, a slightly negative trend can be observed here.
The beverage collection and specialist stores have been able to continuously increase the quota over the last few years, with 44% of the volume sold currently being in reusable containers.
Reusable portion in main sales channels
Categories: Water, softdrinks, juices, functional beverages & beer | Shares based on quantities in liters

Figure 4: Gastronomy with an above-average reusable portion
Beer as the frontrunner for reusables
Among the categories, beer is the frontrunner with 83.4 % and appears to be continuing to grow (see Fig. 5). At 42.4 %, water is just below the overall average, on a par with the previous year and also with a clear increase compared to the last five years.
At 28.5 %, sweet drinks with CO2 account for a lower proportion. Fortunately, however, there is at least a slight trend towards refillable containers.
Reusable portion in main categories
Categories: Water, softdrinks, juices, functional drinks & beer | Shares based on quantities in liters

Figure 5: Trend towards reusable packaging evident in all main categories
Our industry is ready for sustainable packaging
The analysis of beverage sales shows encouraging trends towards glass and reusable containers. Our industry is therefore in a great position to meet the growing needs of consumers and the increasing political pressure for sustainable packaging.